Linear Equations – Definition, Forms, Graphs, and Solutions
Math has a reputation for being complicated. But here is the truth: linear equations are the one concept that quietly powers almost everything around you. Budget planning, speed calculations, predicting sales, even figuring out how long until your pizza delivery arrives. All of it connects back to this single, elegant idea.
I remember sitting in my first algebra class, staring at y = 2x + 3 and thinking, “What does any of this mean?” Then my teacher drew a straight line on the board and said, “That equation IS that line.” Something clicked. And once it clicks, you see linear equations everywhere.
This guide walks you through everything. Forms, graphs, solving methods, word problems, and the mistakes that trip up even strong math students.
What is Linear Equation?
power of any variable is always 1. No squares. No cubes. Just clean, proportional relationships.
The simplest examples look like this:
x + 5 = 92x + 3y = 12y = 4x - 7
The word “linear” comes from the Latin linearis, meaning “resembling a line.” Every linear equation, no matter how messy it looks at first, graphs as a perfectly straight line.
Why are Linear equations important?
Linear equations are the foundation of algebra. Master them and the rest of mathematics opens up. Skip them and you will struggle at every level above.
Beyond academics, engineers use linear equations to model stress on beams. Economists use them to analyze supply and demand. Doctors use them to calculate medication dosages based on body weight. The applications are not abstract. They are everywhere.
Real-Life Examples of Linear Relationships
Think about a taxi ride. The fare starts at $3.00 and increases by $1.50 per mile. That relationship is linear. Write it as f = 1.50m + 3, where f is the fare and m is the miles. Straight line. Predictable pattern.
Or consider a phone plan: $20 flat fee plus $0.05 per text. Plot it and you get a rising straight line. Change the fee and the slope changes too. That is the power of linear equations in daily life.
Forms of Linear equations
Linear equations do not come in just one format. Three main forms exist, and each serves a different purpose. Knowing when to use which form is a skill that separates struggling students from confident ones.
Slope-Intercept Form (y = mx + b)
This is the most recognized form. In y = mx + b, the letter m represents the slope (how steep the line is) and b represents the y-intercept (where the line crosses the vertical axis).
It is the most useful form for graphing quickly.
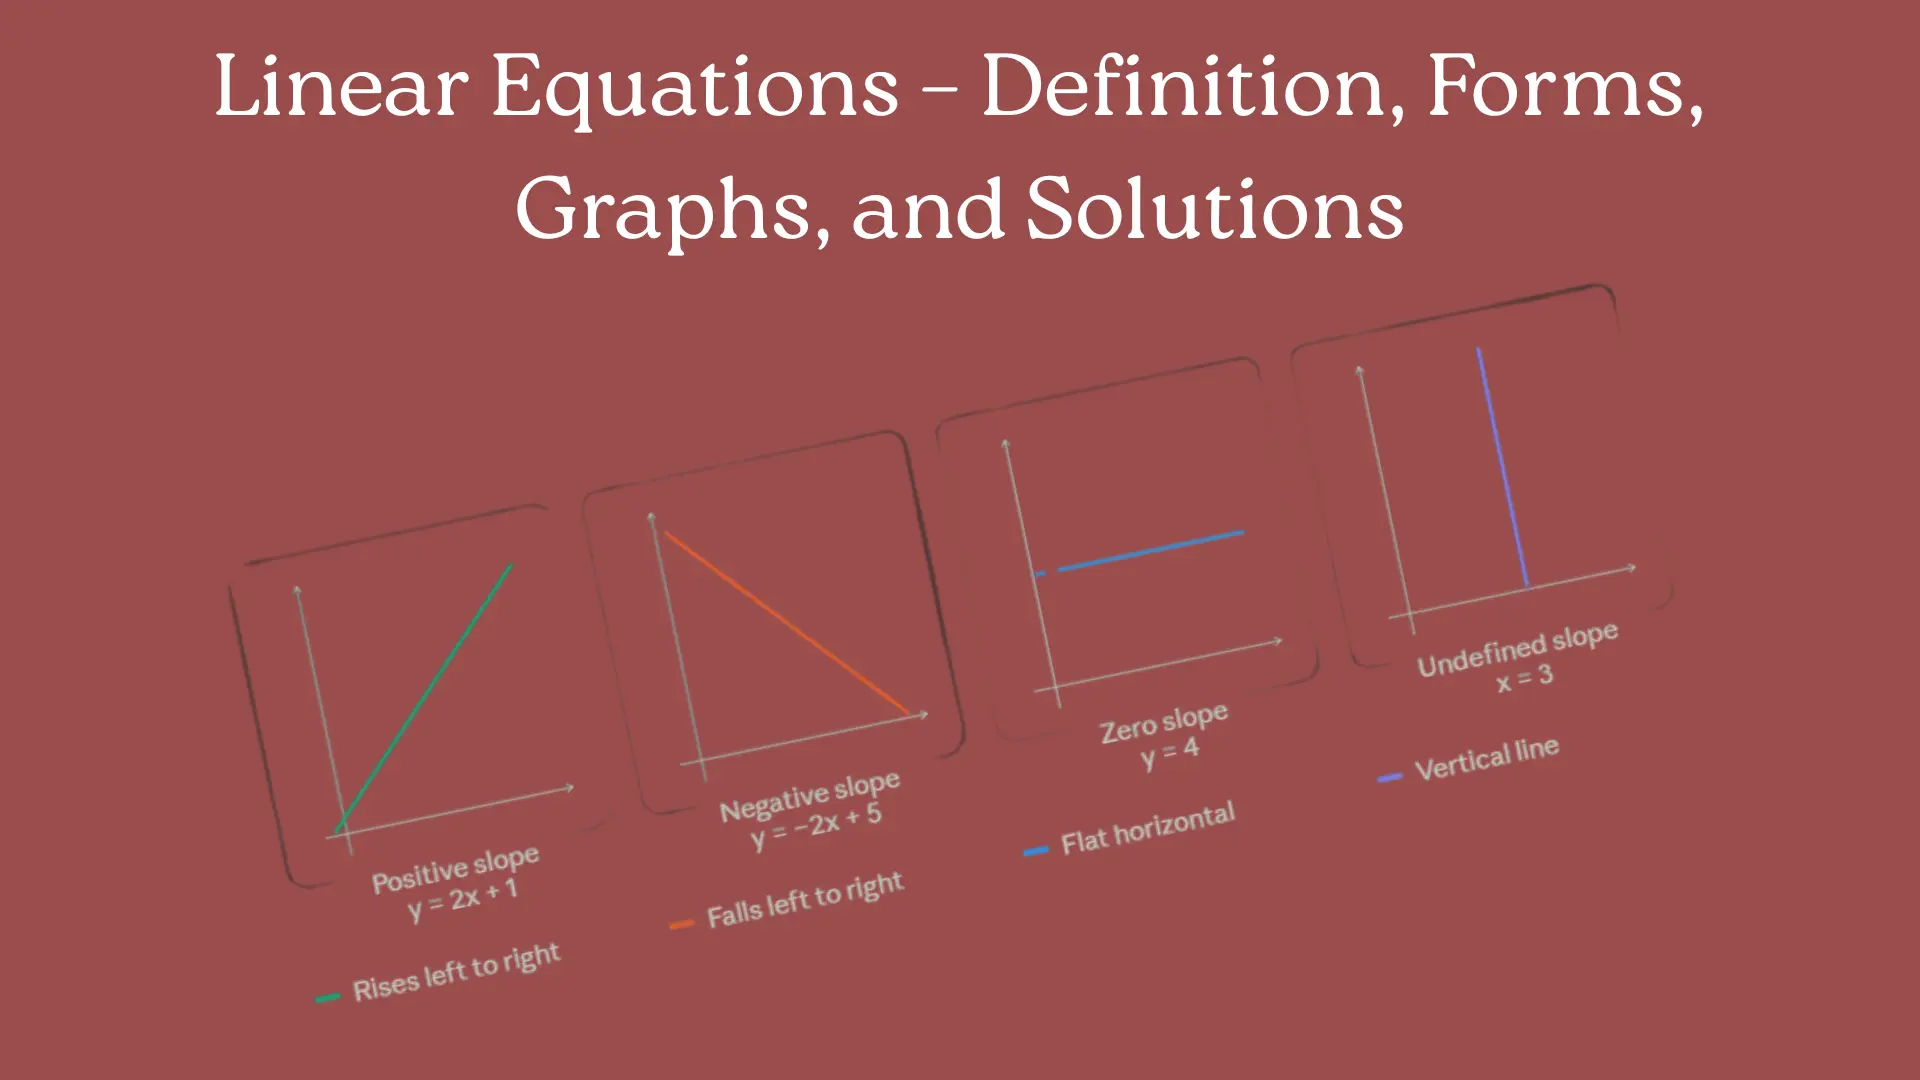
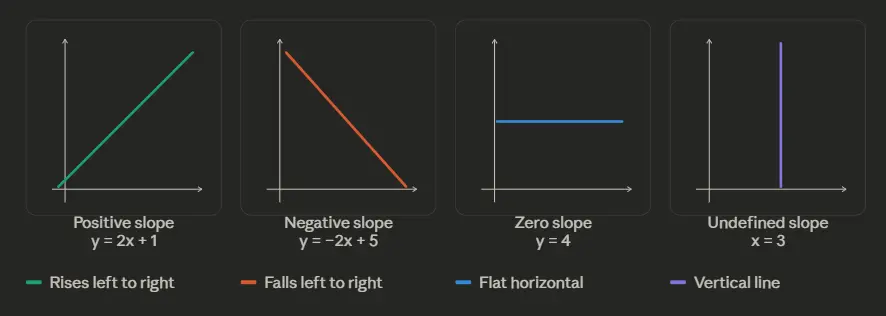
Positive, Negative, Zero, and Undefined Slope
- A positive slope means the line rises left to right. Example:
y = 2x + 1 - A negative slope means the line falls left to right. Example:
y = -2x + 5 - A zero slope is a flat horizontal line. Example:
y = 4 - An undefined slope is a vertical line. Example:
x = 3
Here is what each slope type looks on a graph:
Example
Graph y = 2x + 1. Start at the y-intercept (0, 1). Then use the slope: rise 2, run 1. Plot the next point at (1, 3). Connect the dots. Done.
Point-Slope Form (y − y₁ = m(x − x₁))
This form is ideal when you know one point on a line and its slope, but you do not know the y-intercept yet. It saves time.
y − y₁ = m(x − x₁)
Here, (x₁, y₁) is the known point and m is the slope.
Step by Step Example
Find the equation of a line passing through (3, 5) with slope 2.
- Plug in:
y − 5 = 2(x − 3) - Distribute:
y − 5 = 2x − 6 - Simplify:
y = 2x − 1
Now you have slope-intercept form. Point-slope form is your starting ramp.
Standard (General) Form (Ax + By + C = 0)
Standard form writes everything on one side: Ax + By + C = 0 or equivalently Ax + By = C. The coefficients A, B, and C are integers, and A is usually positive.
To convert y = 3x + 4 to standard form: move all terms to one side. You get 3x - y + 4 = 0.
When to use standard form?
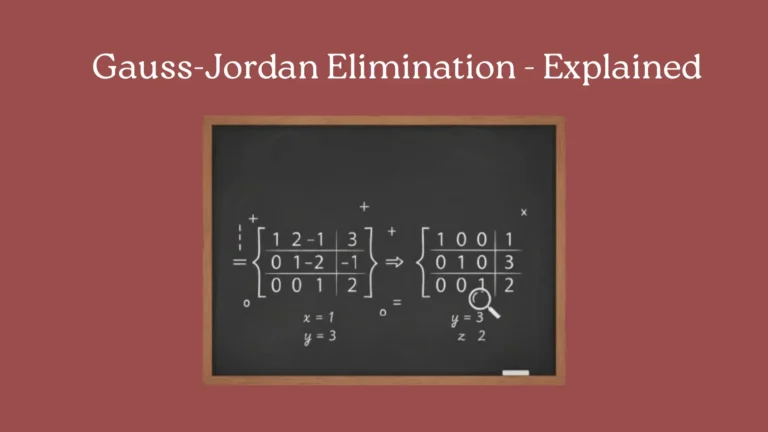
Standard form works best in systems of equations and when both intercepts matter equally. It also comes up naturally in matrix-based methods. When you scale up to solving multiple linear equations simultaneously, the standard form feeds directly into matrix row operations.
That is where techniques like Gauss-Jordan elimination take over, converting your system into an augmented matrix and reducing it step by step until the solution becomes obvious.
Linear Equations in One Variable
A linear equation in one variable contains only one unknown. Solve for that variable and you are done.
Examples:
3x + 7 = 165 - 2x = -3x/4 + 1 = 3
Solving Techniques
Simple equations: x + 4 = 10 → subtract 4 from both sides → x = 6.
Equations with fractions: Multiply both sides by the LCD first. For x/3 + 2 = 5, multiply through by 3 to get x + 6 = 15, then x = 9.
Equations with negative numbers: Be careful with signs. For -2x = 8, divide both sides by -2 to get x = -4. Students often drop the negative here. Do not.
Multi-step equations: 3(x + 2) = 2x + 10. Distribute first: 3x + 6 = 2x + 10. Subtract 2x: x + 6 = 10. Subtract 6: x = 4.
Number of Solutions
Not every equation has exactly one answer.
- One unique solution:
2x + 1 = 7→x = 3 - No solution:
2x + 3 = 2x + 7→3 = 7(impossible, parallel lines) - Infinitely many solutions:
2x + 4 = 2(x + 2)→4 = 4(always true, same line)
Linear Equations in Two Variables
Two-variable linear equations contain both x and y. They cannot be “solved” to a single point without a second equation. Instead, each one represents an infinite set of (x, y) pairs.
Example: 2x + y = 8. Some solutions are (0, 8), (1, 6), (4, 0).
Graphing Two-Variable Equations
The easiest method: find two points, plot them, draw the line. Use the intercepts. Set x = 0 to find the y-intercept. Set y = 0 to find the x-intercept. Connect and extend.
Identifying Slope and Intercepts
Rewrite in slope-intercept form to identify both values fast. For 3x + 2y = 12, solve for y: y = -3/2 x + 6. Slope is -3/2, y-intercept is 6.
Real-World Applications
A store sells two products. Product A earns $5 profit and Product B earns $8 profit. Total profit goal: $400. This gives 5x + 8y = 400. Graph it to see all combinations that hit your target. Businesses use this kind of two-variable modeling constantly, and it scales directly into larger matrix systems as the number of products or constraints grows.
Solving Linear Equations
One-Step, Two-Step, and Multi-Step Equations
One-step: One operation separates you from the answer. x - 7 = 3 → x = 10.
Two-step: Two operations needed. 2x + 5 = 13 → subtract 5 → 2x = 8 → divide by 2 → x = 4.
Multi-step: Combine like terms, distribute, then isolate. Always simplify both sides before moving terms across the equation. That single habit eliminates most errors.
Using Linear Equations to Solve Word Problems
Word problems scare people. They should not. Every word problem is just a hidden equation waiting to be written down.
Distance, Rate, Time Problems
The formula: d = rt (distance equals rate times time). A train travels 300 miles at 60 mph. How long? 300 = 60t → t = 5 hours. Linear. Clean. Done.
Mixture and Cost Problems
A shop mixes $4/lb coffee with $7/lb coffee to get 10 lbs of a $5/lb blend. Let x be pounds of the $4 coffee. Then: 4x + 7(10 - x) = 5(10) → 4x + 70 - 7x = 50 → -3x = -20 → x = 6.67 lbs.
Real-World Modeling
Linear equations shine when modeling steady, predictable change. Population growth at a constant rate, salary increases by a fixed amount per year, water filling a tank at a constant flow. Whenever the rate of change stays constant, a linear equation fits the pattern perfectly.
Linear Inequalities
Difference Between Equations and Inequalities
An equation says two things are equal. An inequality says one is greater or less. Swap = with <, >, ≤, or ≥ and you have an inequality.
Solving One-Variable Inequalities
The process mirrors equation solving, with one critical rule: when you multiply or divide by a negative number, flip the inequality sign. -3x > 12 → divide by -3 → flip → x < -4.
Graphing Inequalities on a Number Line
Here is exactly what both cases look like:

The open circle means 3 is not included. The filled circle means 5 is included. Match the circle type to your inequality symbol and you will never get this wrong.
Graphing Inequalities on a Number Line
For x > 3: draw an open circle at 3 (not included), shade right. For x ≤ 5: draw a closed circle at 5 (included), shade left. Simple visual logic, but it must match your inequality symbol precisely.
Connections to Functions
Linear Equations as Functions
A function assigns exactly one output to each input. Every non-vertical linear equation is a function. Write f(x) = mx + b instead of y = mx + b and you are using function notation, which is standard in higher-level math and calculus.
Identity and Constant Functions
The identity function f(x) = x has slope 1 and passes through the origin. The constant function f(x) = c is a horizontal line. Both are special cases of the broader linear equation family.
Relation to Slope and Rate of Change
In functions, slope represents rate of change. If a function models a car’s distance over time, slope tells you the speed. Understanding this connection transforms slope from an abstract formula into a meaningful, readable value.
As problems grow larger, say five equations with five unknowns, manually tracking slopes and intercepts becomes impractical. That is where matrix tools become essential. The RREF Calculator handles the row reduction automatically, so you can focus on interpreting results rather than grinding through arithmetic.
Frequently Asked Questions (FAQs)
Can linear equations have fractions?
Yes. Fractions appear often in linear equations. The trick is eliminating them early by multiplying through by the LCD. The equation stays linear as long as no variable has a power above 1.
What is the difference between linear and quadratic equations?
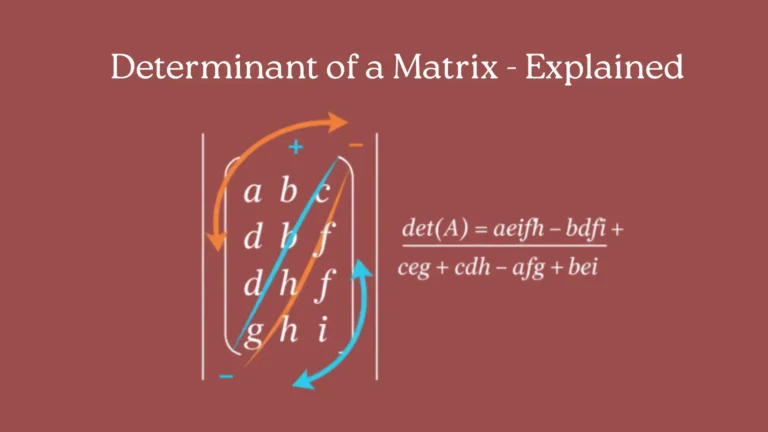
The highest power of the variable separates them. Linear equations have variables to the power of 1. Quadratic equations have variables squared, like x² + 5x + 6 = 0. Quadratics graph as curves (parabolas). Linear equations always graph as straight lines. Once you move into systems involving multiple equations, properties like the determinant of a matrix tell you whether a unique solution exists before you even start solving.
How many solutions can a linear equation have?
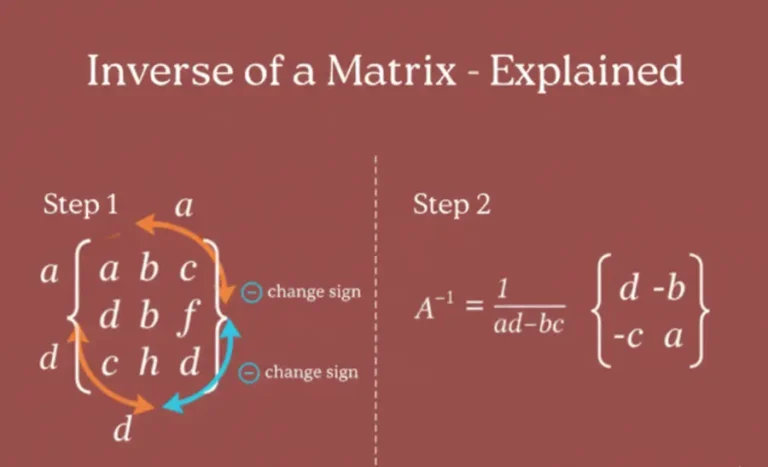
A linear equation in one variable has exactly one solution, no solution, or infinitely many solutions. In two variables, a single equation has infinitely many solutions. Two simultaneous equations typically give one solution, unless the lines are parallel (no solution) or identical (infinite solutions). This same logic applies when you write a system as a matrix. A matrix with a nonzero inverse guarantees exactly one solution. A singular matrix with no inverse means the system either has no solution or infinitely many.
How do you graph linear equations?
The fastest method for slope-intercept form: plot the y-intercept, then use the slope to find a second point and connect. For standard form, find both intercepts by setting each variable to zero in turn, plot those two points, and draw the line through them.